The “State of Devs” results are in!
- From
- Josh W. Comeau
- Reply-To
- me@joshwcomeau.com
- Sent
- June 30, 2025

This issue of my newsletter was sent to newsletter subscribers.
Sign up to receive future issues!
Hi there!
A few weeks ago, I shared the new dev survey from the “State of…” team. Instead of being about CSS or JavaScript or React, this one was about us, the humans who write the code.
Well, the results are in(opens in new tab), and they’re super interesting! I spent a few hours digging through the data, and in this newsletter I’m going to share my findings. 😄
Link to this headingMy main takeaway
After going through the data, the biggest thing that stood out to me is that while things aren’t as good as they used to be, they’re also not as bad as I expected.
For a couple of years now, the discourse in online developer communities has been that things are pretty bleak. Companies are laying off developers by the thousands and potentially replacing them with AI agents. It’s impossible to break in; even industry veterans with many years of experience can’t find work.
The vibes have been terrible, but these survey results paint a bit of a different picture. Things aren’t great, but they’re not apocalyptic either.
For example: we’ve all seen the headlines about layoffs. It seems like every couple of weeks, a major tech company announces that they’re cutting thousands of developer jobs. But in these survey results, ~8% of respondents have reported being laid off in the past year:

It’s hard to know what to make of this number, since I don’t know what the historical standard is, but it’s quite a bit lower than I expected given the discourse. I tried to find some other data, and came across layoffs.fyi(opens in new tab), which shows layoffs slowing since the spike a couple of years ago.
Now, this survey isn’t really a representative sample of all working developers. For example, the median survey respondent has a whopping 10 years of dev experience! So when I saw this chart, I wondered if maybe the true rate of layoffs was actually much higher, but concentrated among devs with less experience.
This survey includes a "Query Builder" that allows us to control for stuff like that, and interestingly, there doesn’t seem to be any correlation between the amount of experience someone has, and how likely they were to be laid off in the past year:

(The percentage who say they’ve never been laid off gets smaller and smaller with more experience, which makes sense to me. The longer you’ve been in this industry, the more likely it is that you’ve worked for an employer that has downsized.)
Another example is salary. If this truly was the end of software development, I would expect salaries to be cratering, but actually, most developers have seen their salary increase over the past year:

Only 9% of respondents report that their income has decreased (and presumably there’s a lot of overlap here with the 8% of folks who have been laid off). Roughly half of respondents say that they’ve gotten a raise within the past year.
Plotting this against Years of Experience, we see that this is true even for folks with less experience:

The survey also asks respondents how many job applications they submitted in order to land their current role. And, honestly, the results were a bit unbelievable:

According to these results, the median developer submitted just 4 applications before accepting an offer for their current role. Less than 10% of respondents said they had to submit 50+ applications.
This seems way too low to me, and if we dig into the details, we see that the truth is more complicated:
- 11% of respondents skipped this question. The survey doesn’t tell us why they opted not to answer, but I think we can infer that for many of them, it’s because they’re still trying to find a job. Some folks in this cohort have surely sent 100+ applications and have yet to receive any offers at all.
- The average number of applications is 12.4, which is way higher than the median number of 4. This means that for developers at the far end of the distribution, they had to send a ton of applications.
- Unlike the previous two questions, this one does vary quite a lot based on Years of Experience:
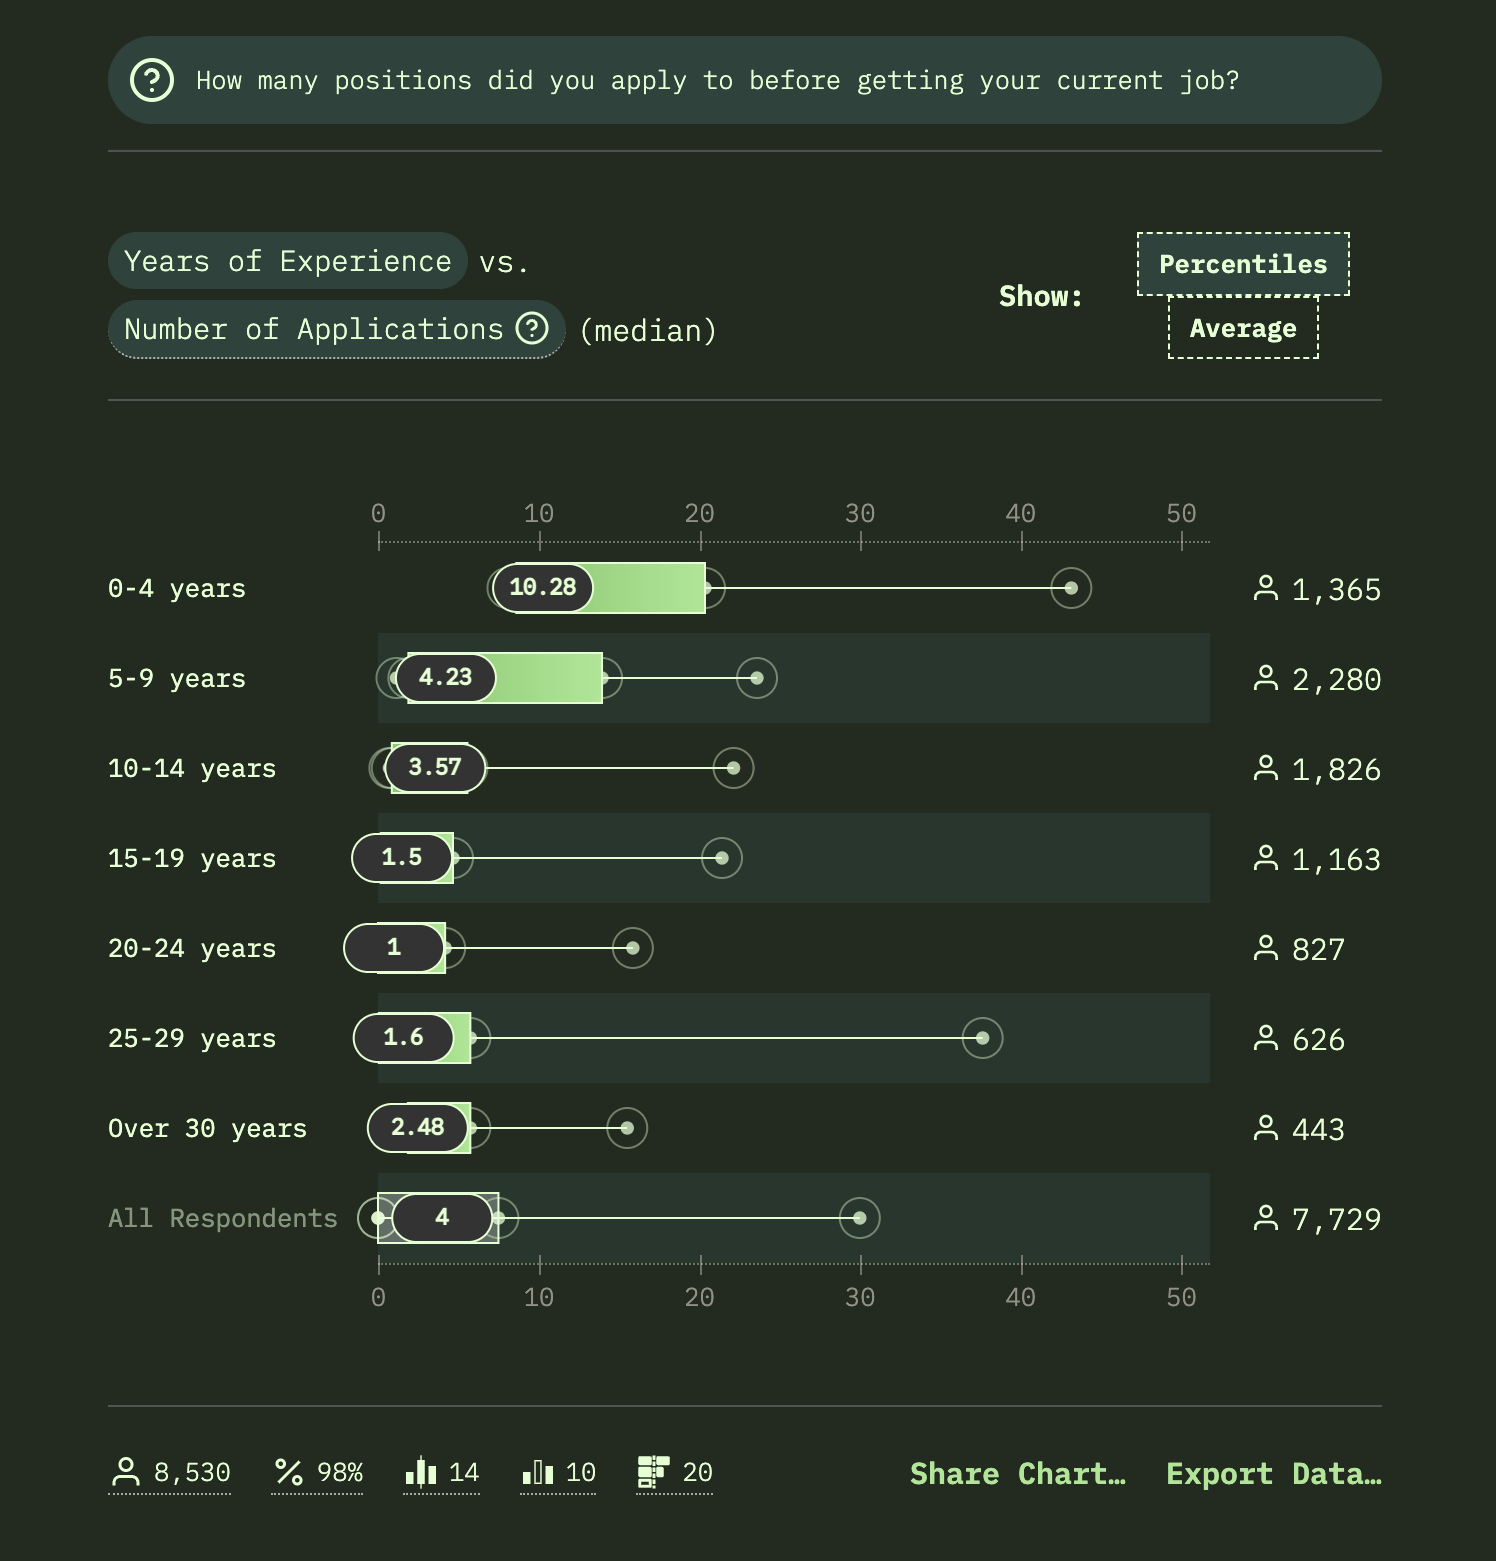
As you might expect, folks in the first few years of their career struggled more to land their current job; the median developer in this cohort had to submit 10 applications. And there’s a big difference between someone with 3-4 years of experience and someone looking for their first job. By lumping them together, this survey conceals how challenging things are right now for folks right at the start of their career.
It’s also interesting that folks with 25+ years of experience also struggled more than average. I know that older developers do face discrimination based on their age, since hiring managers tend to picture software developers as white men in their 20s or 30s, and anyone who doesn’t match that pattern will have a harder time.
We see something similar when we split by gender:

The median number of applications is the same, but the average is wildly different. At the 90th percentile, women had to submit 2.5x more applications to land a job.
This sort of discrimination is awful, but it also isn’t new, which is kind of my point here. These results paint the picture of an industry that is rife with problems, but they’re largely the same problems we had back in 2019. Things have gotten more difficult since then, but this data doesn’t suggest to me that the industry is on the verge of collapse, or that software development jobs are in the process of disappearing.
If you’ve been struggling to find a job, I have a couple of links that might help:
- A few years ago, I wrote a short e-book called “Building An Effective Dev Portfolio”. It’s 100% free, and you can download a copy here(opens in new tab). It covers how to build a portfolio site that helps you stand out from the pile of other prospects, based on what I’ve learned doing career coaching and managing inbound applications at several previous jobs.
- If you’re feeling like there’s no point in learning to code given the advancements of AI, I wrote a blog post that makes the case that AI isn’t a threat to developer employment: “The Post-Developer Era”(opens in new tab). At the very end of this post, I share some job-hunting tips.
That was my main takeaway from the results, but I found a bunch of other interesting nuggets! Let’s go through them.
Link to this headingIt pays to move around
For years and years, I’ve been advocating that developers should change companies every couple of years, both because it helps you grow as a developer, but also because it tends to be the most effective way to earn a lot of money.
This chart shows that well:

This chart is filtered for developers with 10-14 years of experience. The numbers along the left show the total number of employers that the respondent has had. So, the first row shows that for folks who have spent their entire decade-plus career working for the same company, their median salary is US$60,000/year.
By contrast, developers with 10-14 years of experience who changed jobs every 2-3 years will earn a median salary of US$125,000/year. More than 2x as much!
This chart also shows that there’s a danger in changing jobs too often. If you change jobs every year or less, the median salary drops down to US$94,000 (although that's still 50% better than having a single employer!).
Link to this headingRemote workers are happier
Only 5% of employers, according to this survey, have an exclusive in-office policy:
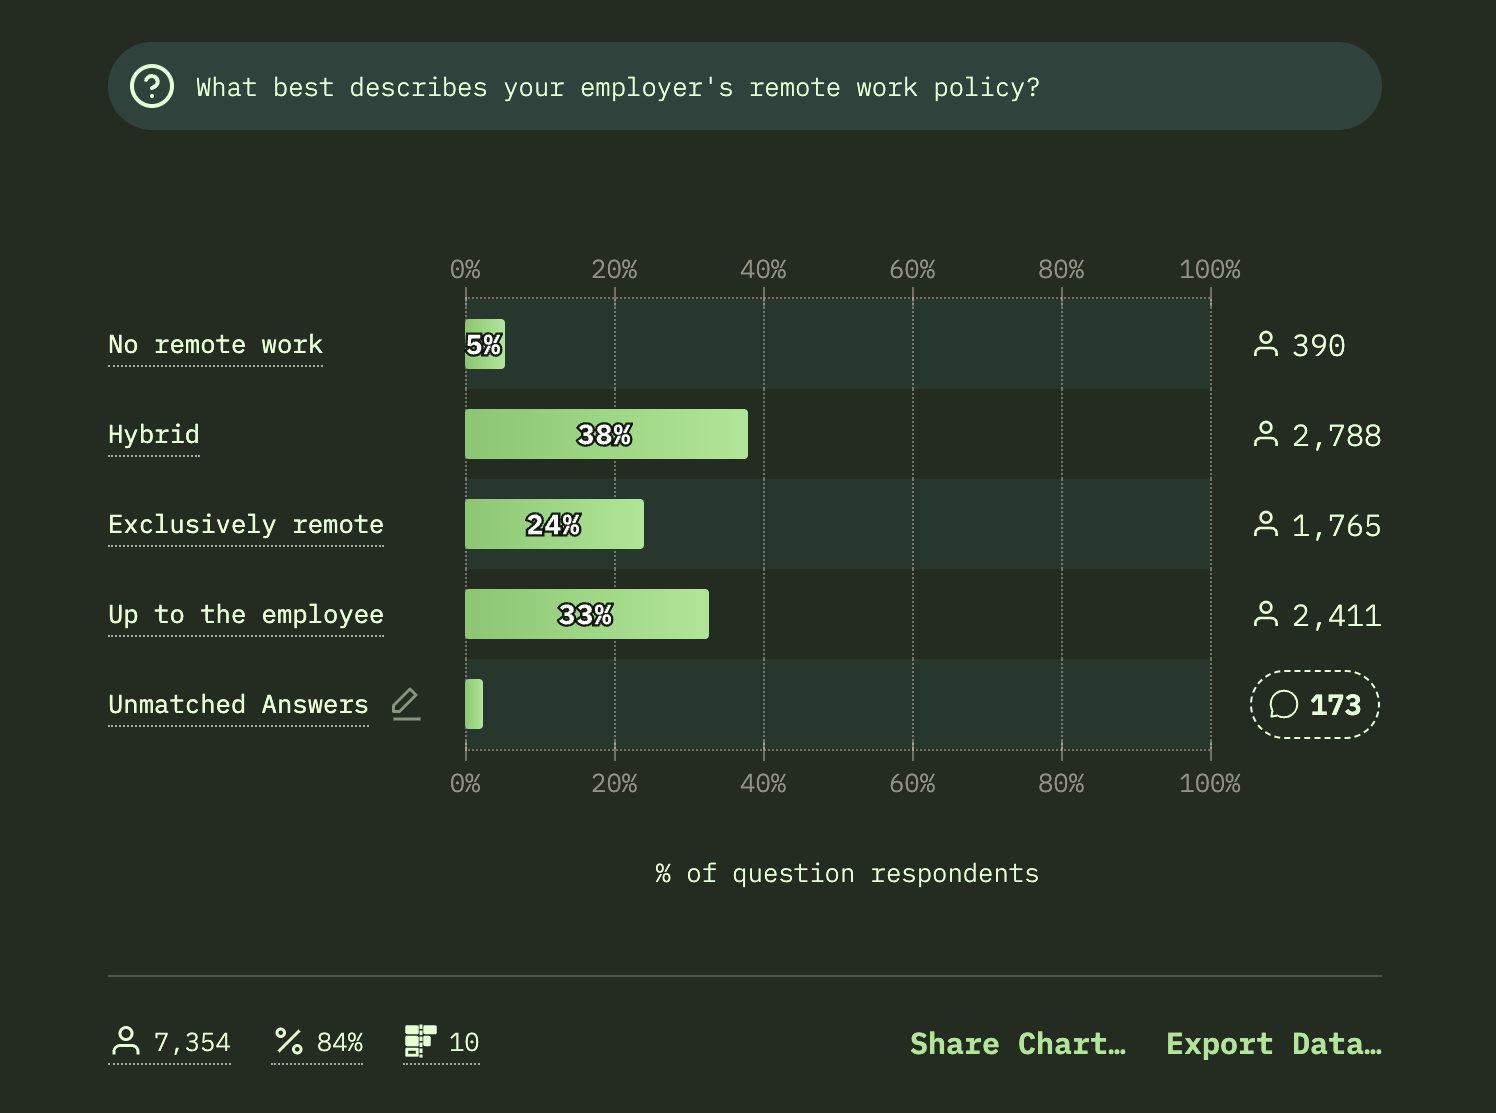
This survey has several categories for remote work; “Hybrid” jobs have mandatory at-work days but permit remote work the rest of the time, while “Exclusively remote” jobs are fully distributed, with no office at all.
When we plot this against Job Happiness, it’s no surprise (to me) that remote workers like their job more:

But interestingly, it turns out remote workers are also slightly happier with their life. Later in the survey, there’s a broader question about happiness, and here’s how it breaks down:

It’s a small but statistically-significant difference (average 3.3 vs. 3.5), but it’s interesting to me because it cuts against one of the most common talking points about remote work: that it’s isolating and bad for our mental health. Some people imagine remote workers as shut-ins, spending the day on their laptop in a dark room, alone. But that’s not the reality for most remote workers.
I started working remotely in 2016, and discovered pretty quickly that I didn’t like working from home. I wound up renting a small private office from a local business. If you’re curious, you can read more about my experience as a remote worker(opens in new tab).
Lots of people think “remote work” and “work from home” are synonyms, but that’s not true. “Remote work” means that you can work from wherever you want. Maybe that’s a home office, or maybe it’s a local library, or a co-working space, or a park. It’s up to you to create your own ideal working environment.
Link to this headingBluesky > Twitter
This one surprised me! Bluesky is more popular than Twitter (“X”):

Now, I don’t really know if this tells us anything, since the ~8700 survey respondents aren’t truly representative of the larger dev community. I think it’s more likely that the survey was promoted more on Bluesky than Twitter. But at the very least, it’s good confirmation that Bluesky is a lively spot!
Twitter has become an incredibly toxic place, and I came to realize that my presence there was actively harmful. Someone might come to Twitter to learn some CSS tricks from developers like me, and wind up being abused by random internet trolls, or tricked by a crypto scam, or sucked into a conspiracy theory. This is true to an extent on all social networks, but it’s particularly bad on Twitter.
So, last year, I migrated from Twitter to Bluesky. It’s honestly been pretty great. It reminds me of how Twitter used to be. You can follow me here:
I also post occasionally on LinkedIn(opens in new tab), though I’m not super active there.
Link to this headingSleep is a challenge
The most commonly-reported health issue, from nearly half of survey respondents, is poor sleep:
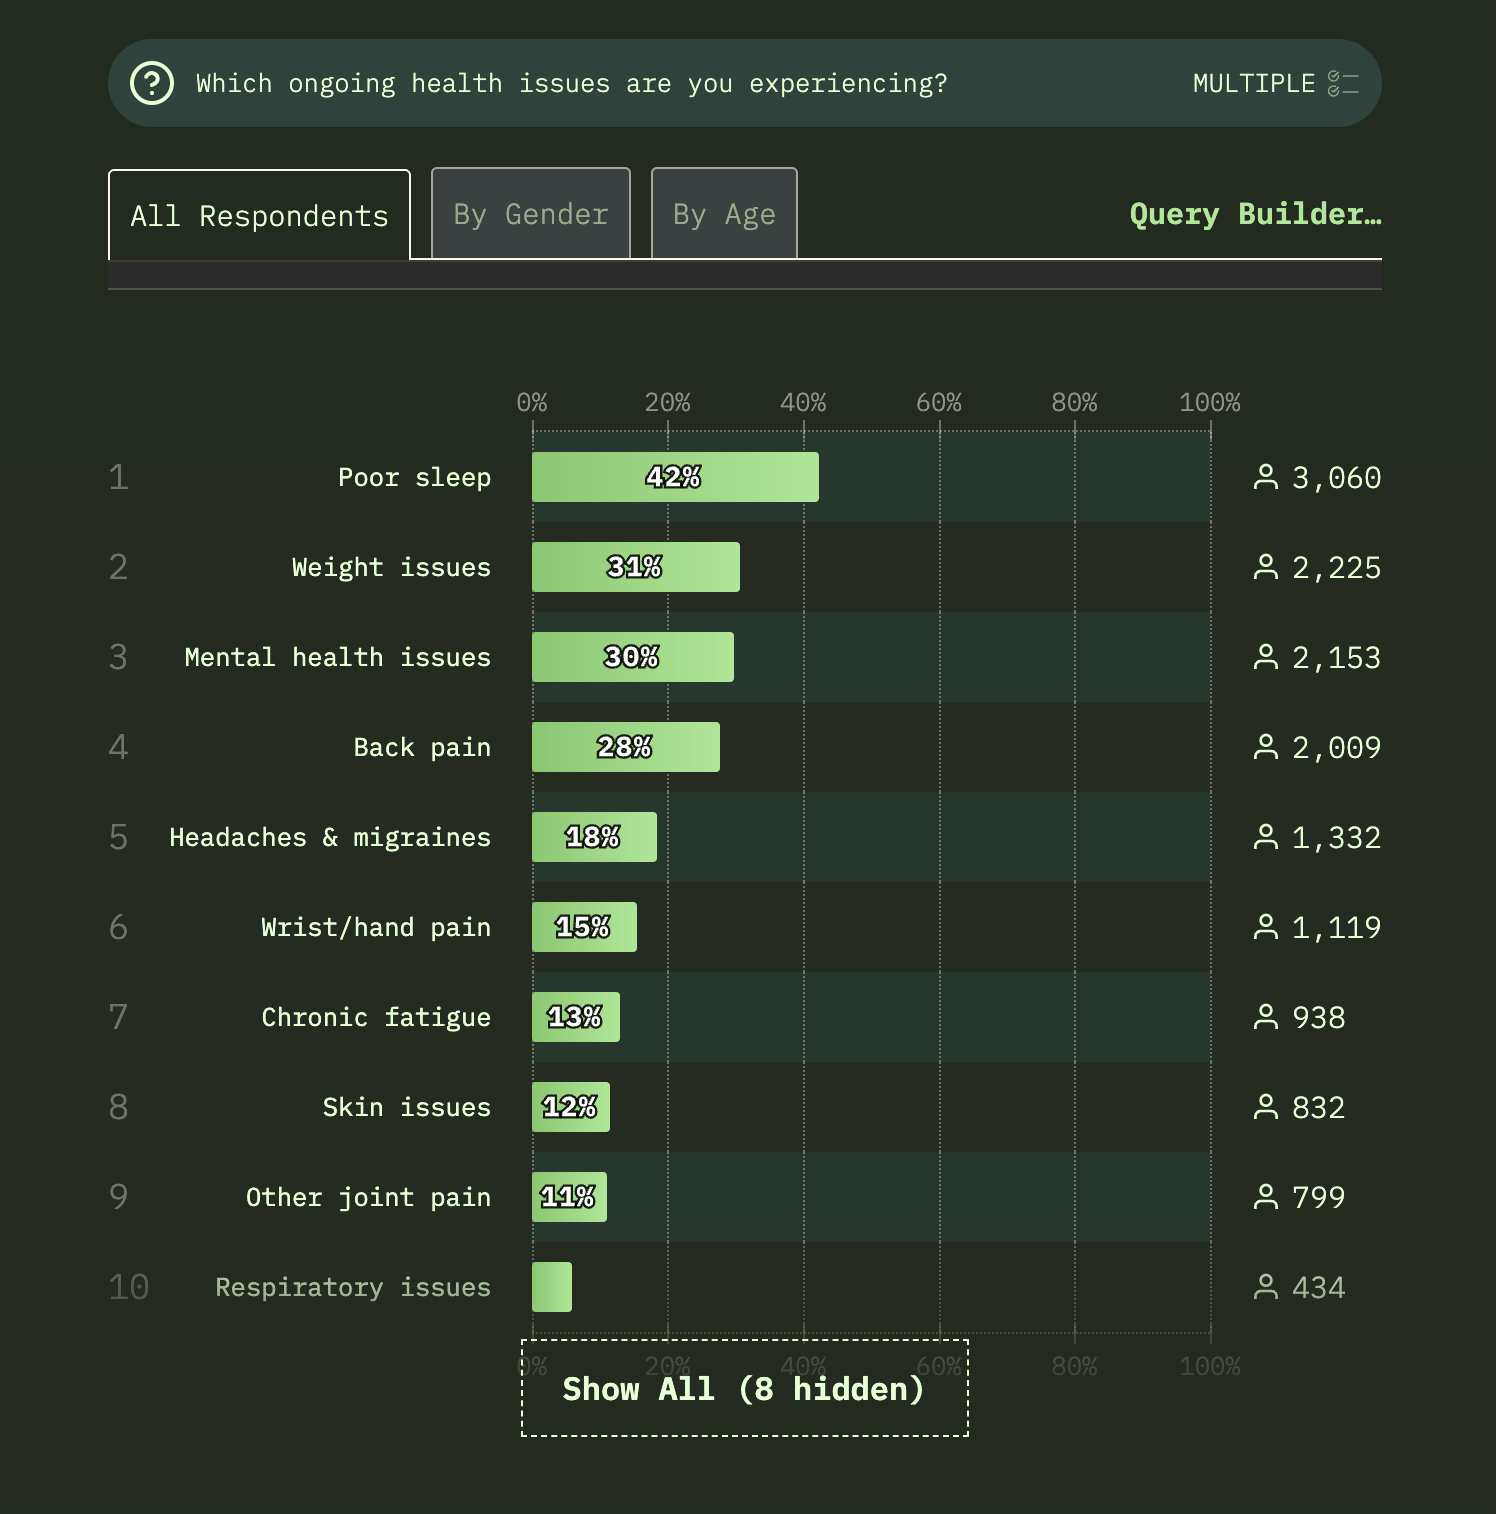
I suspect this isn’t a “developer thing”, I think everyone is having trouble sleeping right now, given the state of the world. 😅
A couple of months ago, I discovered a technique that has worked well for me. It’s called cognitive shuffling. I shared a brief description at the bottom of a previous newsletter issue(opens in new tab). It’s not a miracle insomnia cure, or anything like that, but it’s been more effective for me than meditation, breathing exercises, sleep hygiene, and all of the other common sleep suggestions.
I also saw that 15% of respondents report experiencing wrist/hand pain. This is something I have some experience with; for most of 2020, I was unable to type without burning pain in my elbows and wrists. Fortunately, I was able to find a solution that totally solved these problems for me, and you can read more about it in my blog post “My Personal Experience with RSI”(opens in new tab).
Link to this headingOdds and ends
There are more things I’d love to talk about, but golly, this email is already too long. 😂
Here are some quick final thoughts:
- Canada is the 2nd most popular country for relocation(opens in new tab). I have to admit, it’s pretty great here. It’s like America, but with universal healthcare and a competent federal government. One bit of advice, though: be sure to visit in January or February before deciding to relocate here. You’ll want to see if you can tolerate our winters before making any major life decisions. 😂
- Only 27% of respondents have created or maintained open-source projects(opens in new tab). This number drops to just 7% of respondents in the first 4 years of their career! So, if you’re a junior dev looking for work, this is an opportunity that 93% of other junior devs are missing.
- Developers have great taste in video games(opens in new tab), with Balatro being the 2nd-most-popular game. Sometimes I get tempted to become an indie game developer. Maybe someday.
These have been some of the highlights I’ve found, but there’s way more in the survey. You can browse through the results here:
Hope you found something interesting here!

PS. The “State of CSS” 2025 survey(opens in new tab) is currently open!
If you’ve never taken one of these surveys before, I highly recommend it. In addition to helping the community, they’re also incredibly educational; you’ll learn about a ton of new CSS features and capabilities. I follow this stuff pretty closely and there’s always at least a property or two that wasn’t on my radar.
The survey closes tomorrow, on July 1st, so if you’d like to participate, now’s the time.
This issue of my newsletter was sent to newsletter subscribers.
Sign up to receive future issues!
Interactive Courses
© 2018-present Joshua Comeau. All Rights Reserved.